


Pressure distribution measurement system
The pressure distribution measurement system uses ultra-thin, flexible, and bendable thin film sensors to accurately measure the contact pressure distribution on the contact surface. It can display the entire contact pressure on the contact surface in a two-dimensional or three-dimensional color pressure distribution image and record the entire force process. The real-time detection of pressure distribution data can automatically perform relevant statistical analysis, and can be exported for secondary data analysis or development. At present, the pressure distribution measurement system has been widely used in various application scenarios such as pressure distribution detection throughout the entire chain of new energy lithium batteries and industrial automation detection, empowering various links of the industrial chain.
- Description
-
 Product Introduction
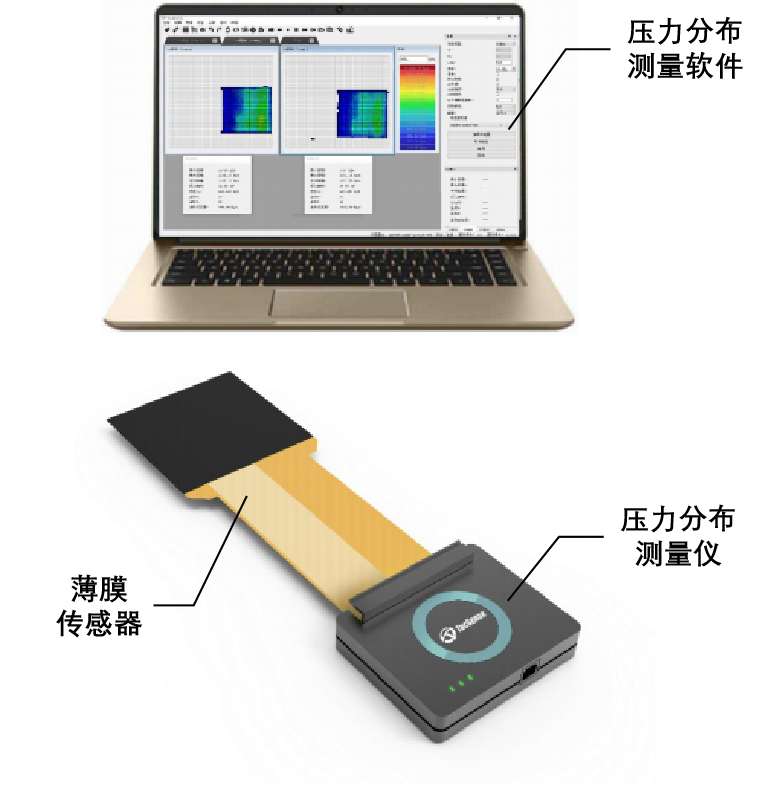
The complete pressure distribution measurement system consists of three parts: a thin-film sensor, a pressure distribution measuring instrument and a pressure distribution measurement software. According to different application scenarios of customers, a variety of pressure sensing arrays of different specifications can be customized, and software automatic statistics, analysis, alarm, storage and recording and other functions can be customized according to customer needs.
 Technical parameters of the pressure distribution measuring instrument
characteristic
DH1-A10 wired version
DH1-W11 wireless version
DH1-A20 dual-machine version
Housing material
Aluminum alloy
Exterior dimensions
102*85*20(mm)
102*90*24.9(mm)
199*85*20(mm)
Interface type
USB 2.0
WiFi
Dual USB 2.0
power supply
5V 0.3A USB port power supply
5000mAh battery / 8 hours of operation
5V 0.3A USB port power supply
Maximum scan rate
50Hz
30Hz
20Hz
Digital pressure resolution
12bit
Maximum density of sensor arrays
64*64 4096 points
64*64 4096 points
128*128 16384 points
Sensor array interface
4X0.5mm 64Pin flexible FPC
4X0.5mm 64Pin flexible FPC
Operating temperature
-40℃—85℃
Operating humidity
0-95%
Thin-film sensor specifications
characteristic
Regular
High-temperature model
High-pressure model
Nonlinearity
<3%
repeatability
<5%
precision
<5%
drift
<5% per log time
Operating temperature
-20℃-60℃
-20℃-230℃
-40℃-85℃
thickness
<0.17mm
<0.17mm
<0.33mm
Pressure range
500KPa
4MPa
4MPa
Pressure points
The highest single piece: 16384 points
Array density
The minimum pitch is 0.5mm/400 dots/cm²
The core function of the pressure distribution measurement software Real-time display of 2D and 3D pressure distribution contours Pressure distribution data is photographed, videotaped and reviewed Based on photographic and video data
Statistical analysis of dimensional data
Real-time statistics generate multi-dimensional pressureForce data over time
The software has a calibration function and can be passedExternal equipment for calibration
Drift calibration function Multi-channel acquisition, up to 100 can be supportedAbove the channel data collection
Automatically generate test reports The software can be quickly customized to your needsMeet the needs of different application fields
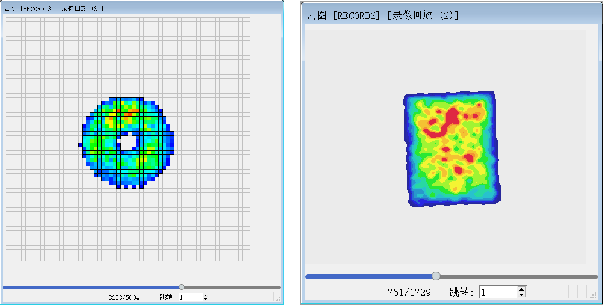
Real-time display of pressure distribution· The pressure distribution map of all grid points can be refreshed in real time, and the 2D grid points, 2D smoothing and 3D display modes can be switched
· The color pressure gamut gradient display can be automatically and dynamically adjusted or manually modified to the upper and lower limits of the pressure display;
· Pressure-sensitive paper mode switching alternates seamlessly
· The cloud image supports left/right mirror rotation
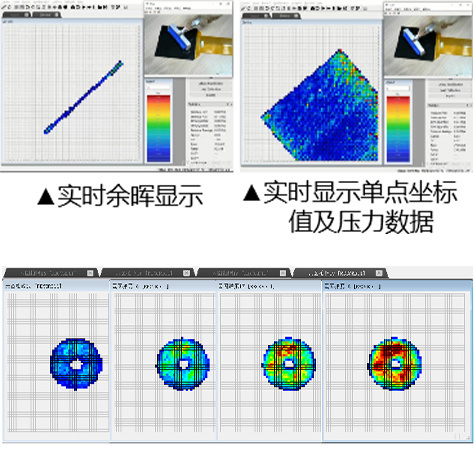
· Move the mouse over any grid point to display the coordinate value of the point and the corresponding pressure data
· Cloud map merging is supported, and multi-channel cloud map stitching such as 2X1, 2X2, 3X1, 3X2, and 4X1 can be selected
· Peak afterglow function: support real-time afterglow display Video afterglow display, sunset cloud map data can be exported
· Support center of gravity and center of gravity change trajectory display
· One-click clearing function
· Ranging function
 Take photos, videos, and export data
· Take photos: Capture multi-channel 2D/3D pressure contour photos in real time
· Photo files can be reloaded for partition statistical analysis, and PNG images or CSV pressure data can also be exported
· Recording: It can be recorded at a set interval
· It supports loading playback, pause, forward, backward, skipping frames and other operations, supports offline loading, supports multi-channel simultaneous loading, and can export MP4 video or csv pressure data format
 Statistical analysis of data
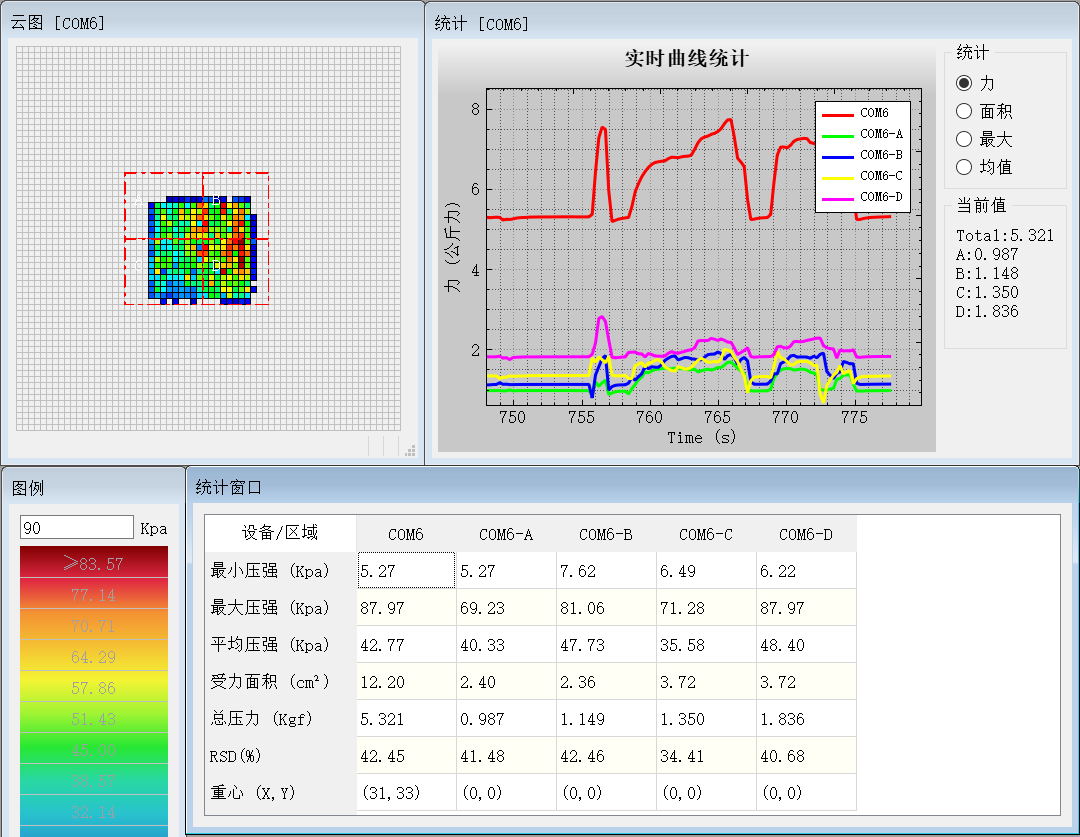
· Real-time statistical analysis: The real-time pressure contour diagram can be automatically or manually divided into partitions, and the pressure, pressure, area, etc. of the whole or partition can be counted and the time variation curve can be generated
· Statistical analysis of video recording: The frame number range, statistical frequency, and whole region or sub-region can be selected for pressure, pressure, and area statistics and time variation curves can be generated for video files, and Excel data can be exported for all time curves
Related Products
Get the latest product information
Contact Us Contact Us

Industrial applications: equipment for testing the expansion force of battery cells, testing the capacitance of battery cells, testing the pressure bonding and flatness of industrial machines.
Contact: Mr. Chen 18026916463
Consumer electronics applications: TWS,OWS, Switch replacement application.
Contacts: CLT 13823378048
Lithium battery lifecycle system: 0755-86535421

©COPYRIGHT 2023 TacSense Technology (Shenzhen) Co., Ltd. ALL RIGHTS RESERVEDGuangdong ICP No. 20062627Website construction:China Enterprise Power Shenzhen SEO
-
-
-
Online consultation
Service Time:8:00-20:00
Business negotiation:
Industrial and new energy pressure distribution measurement equipment:Mr. Chen 18026916463
Application in various industries of consumer electronics:Mr. Chen 13823378048
Lithium battery lifecycle system:0755-86535421
-

-
-
©COPYRIGHT 2023 TacSense Technology (Shenzhen) Co., Ltd.
Website construction:China Enterprise Power Shenzhen SEO